Albert Einstein once said:
“Imagination is more important than knowledge. For knowledge is limited to all we now know and understand, while imagination embraces the entire world, and all there ever will be to know and understand.”
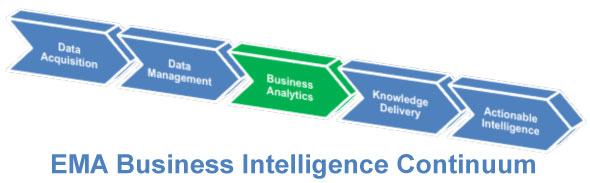
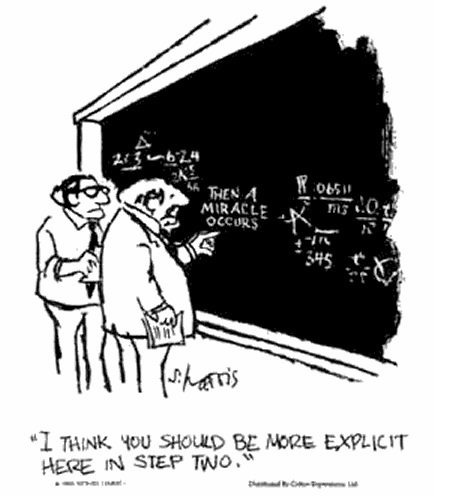
And I think that the wonderful world of Knowledge Delivery (aka Data Visualization, Reporting, etc.) needs to think a little more like dear old Albert… The mainstream of Knowledge Delivery has adopted some strict rules, or grammar, associated with the presentation of information in dashboards, reports, etc. Some are great ideas. Some however, are beginning to dilute the adoption of Knowledge Delivery for the sake of the “prim and proper” presentation of the data.
If one of Knowledge Delivery’s main goals is to trigger a “call to action”, why then should be make it difficult to make a decision on that action. Knowledge Delivery, in certain instanced, has evolved into to PT Barnum’s “This Way to the Egress” sign. Overly complex? Yes. Too cute by half? Almost. Let’s give people the information that they need for that “call to action. And let’s do so in the most easily digested format possible with an “Exit” sign.
This is not to say that Knowledge Delivery should be dumbed down to the lowest possible denominator. No sir… However, each audience should be considered and addressed with the proper information and presentation format.
With that stated, here are my 2013 thoughts on the world of Knowledge Delivery:
- Infographics are here: USA Today is an interesting little publication. Since its inception, it has been a brightly colored and “simply” presented paper to fight the grim and gray national papers. While the USA Today isn’t in the same editorial or journalistic class as the NY Times, Wall Street Journal or Washington Post, it has made an impact on the way that papers are presented. Infographics are the USA Today of data visualization. They are bright, brassy and simple. And they are here to stay just like USA Today.
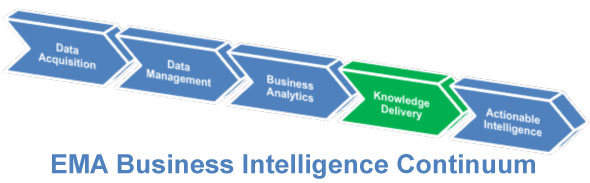
- Dashboards need to be more “inviting”: Because infographics are here to stay, dashboards are going to be pushed to provide a more inviting or interesting presentation layer. “Grammatically” precise visualizations, while accurate, will be like the “back half” of most annual reports. The interesting information is presented up front. The accurate numbers are in the back. Dashboards will need to add elements of the infographic to maintain their place or risk being relegated to the “appendix” of the Knowledge Delivery stack.
- Mobile visualization will blossom with enterprise tablet adoption: Smartphones are great devices. However, beyond looking at a pie chart or a “stoplight” graphic, you can’t put much on the screen of the average smartphone beyond one graphic. Much more and you are either straining the eye of the user or the imagination, by scrolling around with pinches and swipes. However, the tablet has/will unleash mobile business intelligence with its larger canvas. As enterprise tablets gain a stronger foothold, we’ll see the consumption and creation of mobile business intelligence take off…. Finally!
- Reports aren’t dead… But they are close: Statics reports ( ala the infamous TPS report ) aren’t dead quite yet. However, I dare say that they are in the same place as print magazines and newspapers…. There is a limited and aging audience for static reports. With all of the advances in Knowledge Delivery over the last 3-5 years, static reports should be placed in a glass case that says, “Break only in the event of SEC or IRS request”.
- 3D pie charts aren’t bad… They are just drawn that way: 3D pie charts aren’t the evil that most people think. They are just a misunderstood graphic. Sure, they offend the “grammar” police of data visualization, like ending a sentence with a preposition or an ampersand in a business document. However, if they are bright, get adoption and move people to act, who cares what they are made of? Or, that they make the slices in the back look proportionately smaller & those in front that much bigger…. Remember this is the age of the infographic! We can let some things slide.
What say the readers?
Are infographics the knowledge graffiti of the 2010s? Will I pry your TPS reports from your cold dead fingers? Do 3D pie charts make your skin crawl like fingers on chalkboard?
Provide your comments below and/or ping me via twitter at @JohnLMyers44 with the hashtag #100LinesOnBIDW.
Next week, I will cover Actionable Intelligence…. I hope you continue the journey with me.
NOTE – For those unfamiliar with the song “88Lines about 44 Women” by the Nails, I highly recommend you give it a try. At the very least, it was the inspiration for this series of blogs.